

If you are a CFO, controller, or VP of Finance at a company that runs a loyalty program, there is a number in your annual plan you probably inherited rather than built. It is the breakage rate. Somebody set it at last year-end, held it flat across all twelve months, and moved on. Come December, you rerun the analysis and the number has moved. Because it sits on top of a balance of outstanding points worth hundreds of millions, a small move lands as a very large number in the P&L.
Every loyalty program cost calculation rests on one assumption, and it is this one. Points that get redeemed cost real money. Points that never get redeemed cost nothing. So the share you expect to be redeemed determines the cost you book, which makes breakage the input that sets the shape of the entire calculation.
Want to know whether your breakage assumption holds up? Book a conversation with the KYROS actuarial team or read the Hidden Economics of Loyalty report for the benchmark data behind ultimate redemption rate and CLV.
What Is Loyalty Program Cost Calculation?
Loyalty program cost calculation is the exercise of forecasting what the points you have already issued will actually cost the business when members redeem them.
At its simplest:
Expected Redemption Cost = Points Issued × Ultimate Redemption Rate (URR) × Cost per Point
And for what has accumulated on the balance sheet:
Points Liability = Outstanding Points × Expected URR × Cost per Point
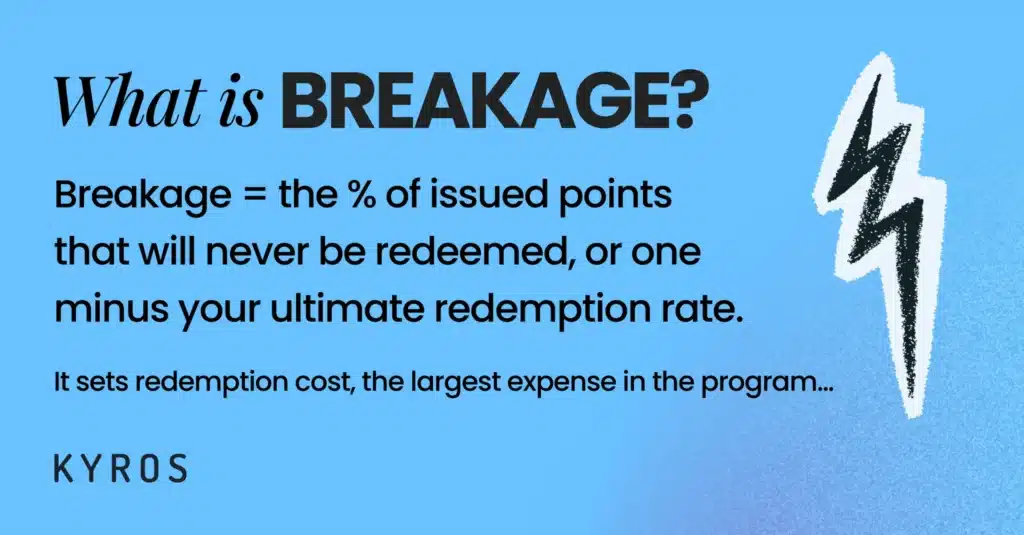
Two of the three inputs are things you already know. Points issued is a count. Cost per point is largely set by your redemption catalog and partner rates (with some uncertainty based on the mix of redemptions). The ultimate redemption rate is the input that has to be predicted and has the biggest impact, and breakage is its mirror image: breakage is one minus URR, the share of points that will never be redeemed.
So a loyalty program cost calculation is only ever as good as its breakage estimate. Everything downstream inherits whatever error sits inside it: redemption cost, loyalty program liability, deferred revenue, margin.
For the full accounting treatment of what this produces on the balance sheet, see Loyalty Program Liability: 3 Things Every Accountant Needs to Know (2026 Update).
For the cost categories themselves and how to track them, see How to Design and Track Loyalty Program Costs the Right Way.
The Three Bases of Ultimate Redemption Rate, and Why Mixing Them Breaks the Calculation
Ultimate redemption rate, and the breakage rate built on it, can be calculated three different ways. Each answers a different question and each belongs in a different formula.
1. URR on outstanding points. Of every point issued but not yet redeemed or expired, what share will eventually be redeemed? This is the base that matters for the loyalty program liability sitting on the balance sheet.
2. URR on cumulative earned points. Of every point ever issued, what share has been or will be redeemed? This one tracks the full lifetime picture rather than a single moment in time.
3. Current-month URR. Of the points issued this month specifically, what share will eventually be redeemed? This base does two jobs. It sets the revenue you defer each month, and, tracked as a time series, it shows the trajectory of the rate, which is what financial planning needs in order to forecast where the number lands at next year-end.
Mixing these bases is like mixing Fahrenheit and Celsius. Both describe temperature, but nobody sets a thermostat to 70 degrees Celsius. The units are not interchangeable, and neither are the bases.
Using the wrong base in the wrong formula is the single most common mistake KYROS sees companies make. In client work, KYROS has seen it overstate a loyalty program liability by 50%. Not from a modeling flaw, but from plugging one rate into a formula that called for a different one.
What to do instead: track at least two bases. URR on outstanding points, which tells you what is sitting on the balance sheet today, and current-month URR, which tells you where the rate is heading. A single number cannot do both jobs.
Breakage Accounting: What ASC 606 and IFRS 15 Require Every Month
Breakage accounting is where the current-month rate stops being an analytical nicety and becomes a monthly obligation.
Under ASC 606 and IFRS 15, the main accounting standards governing loyalty programs, a portion of revenue has to be deferred every month against the points issued in that month. Getting that deferral right requires the current-month URR for that specific batch of points, not a program-wide average.
That requirement is what forces granularity. You cannot defer revenue correctly on this month’s points using a rate calculated across every point ever issued. The bases are different, and so are the answers.
It is worth being precise about scope here, because the term gets used loosely. This is breakage on points and miles inside a loyalty program. Gift card breakage is a separate topic with different mechanics and different accounting treatment.
Related: Loyalty Program Liability: The Complete Guide for Finance and Accounting (2026).
Why Loyalty Program Cost Calculation Changes Over Time: Mix Shift
Mix shift is the number one driver of change in ultimate redemption rate. The mix of customers earning points twelve months from now will not look like the mix earning points today, so the rate that applies to today’s points will not apply to next year’s.
Most in-house models cannot see this. A spreadsheet producing a single number is usually looking at data in aggregate, or sliced one or two ways. In practice there are tens of distinct dimensions along which mix can shift for a single program at any moment.
Mix shift also accelerates every time a program changes: a new co-brand credit card, a revised expiration rule, a new redemption partner, a push on member acquisition. There is no successful loyalty program anywhere sitting still. Continual iteration is the entire point of running one, which makes mix shift permanent background conditions rather than an occasional event.
Two questions worth asking your own team: how do our models respond to mix shift, and which dimensions is our mix shifting along right now? If nobody has an answer, the assumptions behind your largest expense line are probably not responsive to what is happening underneath the program.
Is Our Breakage Rate Normal? How KYROS Benchmarks It
This is the first question most loyalty leaders ask, and the honest answer has two parts.
Industry loyalty program benchmarks give you a gut check. KYROS can say quickly whether a rate looks high, low, or roughly where it should be for a program of that type. That is useful as a first pass and no more than that.
The real answer requires the data, because every program is different and so are the behaviors inside it. KYROS models at the level of the individual point: what is known about that point, and what is known about the member who owns it, used to predict the likelihood that specific point gets redeemed.
Sophisticated models are only half of it. They are also built to be transparent, so a finance team can see what typically happens with a given type of point and what the long-term redemption patterns have looked like historically. That matters because a number you cannot explain is a number you cannot defend to your CFO, to your board, or to your auditor’s actuary.
Why a Falling Breakage Rate Improves Loyalty Program ROI
Decreasing breakage looks like a problem on a cost line, because it means redemption cost is increasing. Read over a longer horizon, a decreasing breakage rate is usually a sign the program is working.
Here is why. When breakage falls, it generally means you are accumulating highly engaged, high-value members, which is to say the people who redeem. A larger share of your points end up owned by members more likely to use them, so the rate on future points keeps drifting down. That is mix shift working in your favor.
The Hidden Economics of Loyalty report put numbers on this. KYROS studied how customer lifetime value changes at a member’s first redemption, comparing redeemers against a look-alike group of members who were equally engaged but did not redeem. The gap in subsequent profitability ran on the order of hundreds of dollars per member. Redemption is the inflection point where lifetime value turns. Read the full findings.
Giving away more points does compress margin in the short term. Over a multi-year horizon, the revenue volume it buys more than offsets that compression, which is the trade every loyalty program is making whether or not it says so out loud: margin for long-term volume. The chain runs further than the program P&L. Companies are valued on the profit they will generate in future. Rising customer lifetime value means more of that future profit, which means rising enterprise value.
A loyalty program cost calculation read on its own, without the revenue side, will always point toward the wrong decision.
See how KYROS models the relationship between redemption, breakage, and CLV. Talk to our team.
Why Breakage Causes Year-End Surprises in Loyalty Program Liability
Here is how the surprise gets built, and it is almost always the same sequence.
Someone builds the annual financial plan in January. They take whatever breakage was as of December 31 and hold it constant for all twelve months, because forecasting where it is going is genuinely hard and most companies do not know how. Mix shift then does what mix shift does. By the time the year-end analysis is rerun to book the liability, the rate is a different number than the one in plan.
That variance alone creates volatility. The damage comes from leverage: multiply the gap by a massive balance of outstanding points and it becomes tens of millions of dollars nobody planned for. A great many finance teams have come to treat this as simply how loyalty accounting works: an annual hit of unknown size, absorbed every December.
It does not have to work that way. Where breakage is heading can be forecast, and once it is, the year-end number stops being a surprise. Everybody who works in finance wants the same thing: stable, accurate, predictable results. That is achievable here.
The Loyalty Program Breakage Monitoring Checklist
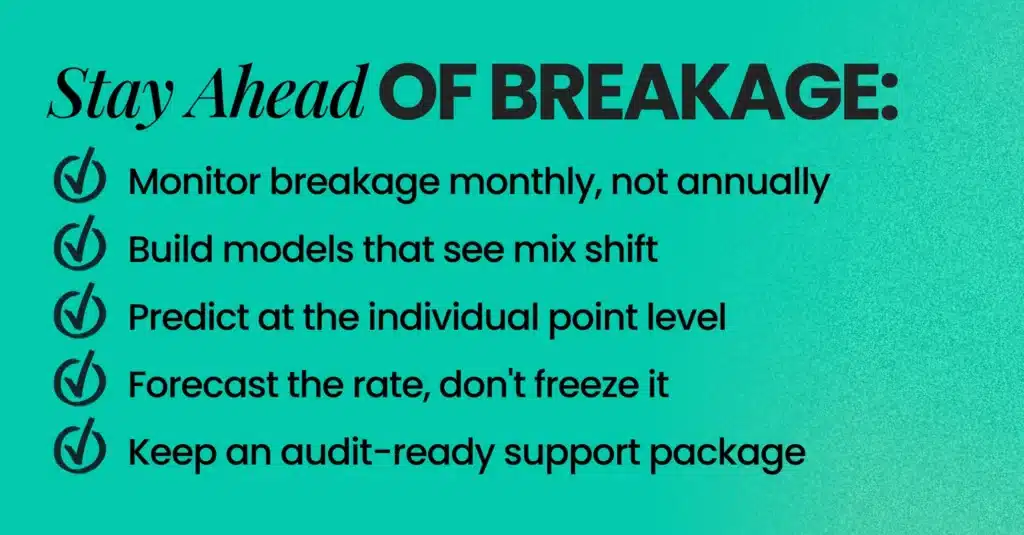
1. Monitor monthly. The single most important habit. A monthly review surfaces risk early and gives a forward-looking read on customer lifetime value.
2. Build models that respond to mix shift. Mix shift is the leading driver of change in the rate over time, so a model that cannot see it will drift.
3. Predict at the individual point level. Accounting standards require isolating specific sets of points by issuance month and by member in order to defer revenue correctly. Aggregate models cannot do this.
4. Forecast where breakage is heading. Do not settle for a single number covering points issued to date. The rate will move; the only question is whether you saw it coming.
5. Stay audit-ready. Keep a thorough loyalty program liability support package, exhibits included, that an outside actuary can follow without a guided tour.
Why Loyalty Program Cost Calculation Needs Actuarial Domain Expertise
Breakage is typically classified as a critical accounting estimate, because auditors recognize that a small change in the assumption can materially change the financial statements. Which means it will be audited. Whichever firm signs the opinion, EY, PwC, or KPMG, it will bring in its own actuary to validate the number.
That audit goes one of two ways. With a tight package of exhibits laying out how you reached your conclusion and why it is reasonable, the outside actuary reads it and moves on. Without one, they start asking nuanced actuarial questions the loyalty team cannot answer, reach a different conclusion, and force a change to what was booked. That has happened. It is worth a lot of effort to avoid.
Quantitative skill is not the same thing as domain expertise. A data scientist, an accountant, or a generalist actuary can all build a model. Building the right model for a loyalty program is a different problem. It is the reason you find the best brain surgeon in the city rather than asking your family physician. Both are doctors. Domain expertise decides the outcome.
Loyalty programs sit at the intersection of actuarial science, data science, finance, accounting, and economics, and they behave very differently from the insurance portfolios most actuaries train on.
More on this distinction: Measuring Loyalty Program ROI: Financial Metrics That Actually Matter.
Loyalty Program Cost Calculation FAQs
What is the biggest cost in a loyalty program?
Redemption cost, by a distance. It is the single largest expense in the loyalty program business model, which is why the breakage assumption underneath it carries so much weight.
Why is our loyalty program cost calculation always wrong at year-end?
Almost always because breakage was held constant in the annual plan. Mix shift moves it during the year, and the gap gets multiplied across a large balance of outstanding points.
How often should we check our breakage rate?
Monthly. That is the KYROS best-practice cadence, and it is the recommendation to start with if you only change one thing.
Does a high breakage rate save the company money?
Short term, it can look that way, since unredeemed points cost nothing. Long term it usually signals deteriorating customer lifetime value, because engaged members are the ones who redeem.
Can our finance team calculate breakage in-house?
They can produce a number. Whether it is the right number, and whether it survives an auditor’s actuary, depends on whether the model predicts at the individual point level and responds to mix shift.
Is loyalty program breakage the same as gift card breakage?
No. This covers points and miles inside a loyalty program, which behave differently and fall under different modeling and accounting treatment.
What This Means for Loyalty and Finance Leaders
The chain is short and it only runs one direction. Breakage sets redemption cost. Redemption cost shapes customer lifetime value. Customer lifetime value drives enterprise value. Get the first link wrong and every number after it inherits the error.
Three things to take away:
- Stop treating breakage as an annual event. Monthly monitoring turns it from a year-end surprise into a forward-looking signal.
- Check which base your formula is using. This is the most common and most expensive mistake in the category, and it is entirely avoidable.
- Forecast the rate, do not freeze it. Mix shift guarantees the number will move. Planning as though it will not is a choice, not a constraint.
Get this right and you get what every finance team actually wants from a loyalty program: stable, accurate, predictable results, with nothing waiting in December.
Not confident in the breakage assumption behind your loyalty program cost calculation? Talk to the KYROS actuarial team, or start with the Hidden Economics of Loyalty report for the full data behind ultimate redemption rate and CLV.


